Chart is a graphical representation of data that enables user to easily understand the large quantity of data and relationships between parts of data. There are many types of charts available in Microsoft Excel and almost all of them are supported by Aspose.Cells for Java. Aspose.Cells can be used to create, edit and manipulate Excel spreadsheets almost in any platform without any need to install Microsoft Excel or without using any sort of Microsoft Office automation.
Article Description
The purpose of this article is to explain how developers can create Microsoft Excel Line Chart in Java.
Supported Platforms
Aspose.Cells API supports various platforms including Java, .NET, C++, Android, JavaScript, PHP etc. Besides, Aspose.Cells is available in Cloud as RESTful APIs.
Types of Line Charts
There are various types of Line charts, some of them are listed below.
- Line
- Line Stacked
- Line 100% Stacked
- Line with Data Markers
- Line Stacked with Data Markers
- Line 100% Stacked with Data Markers
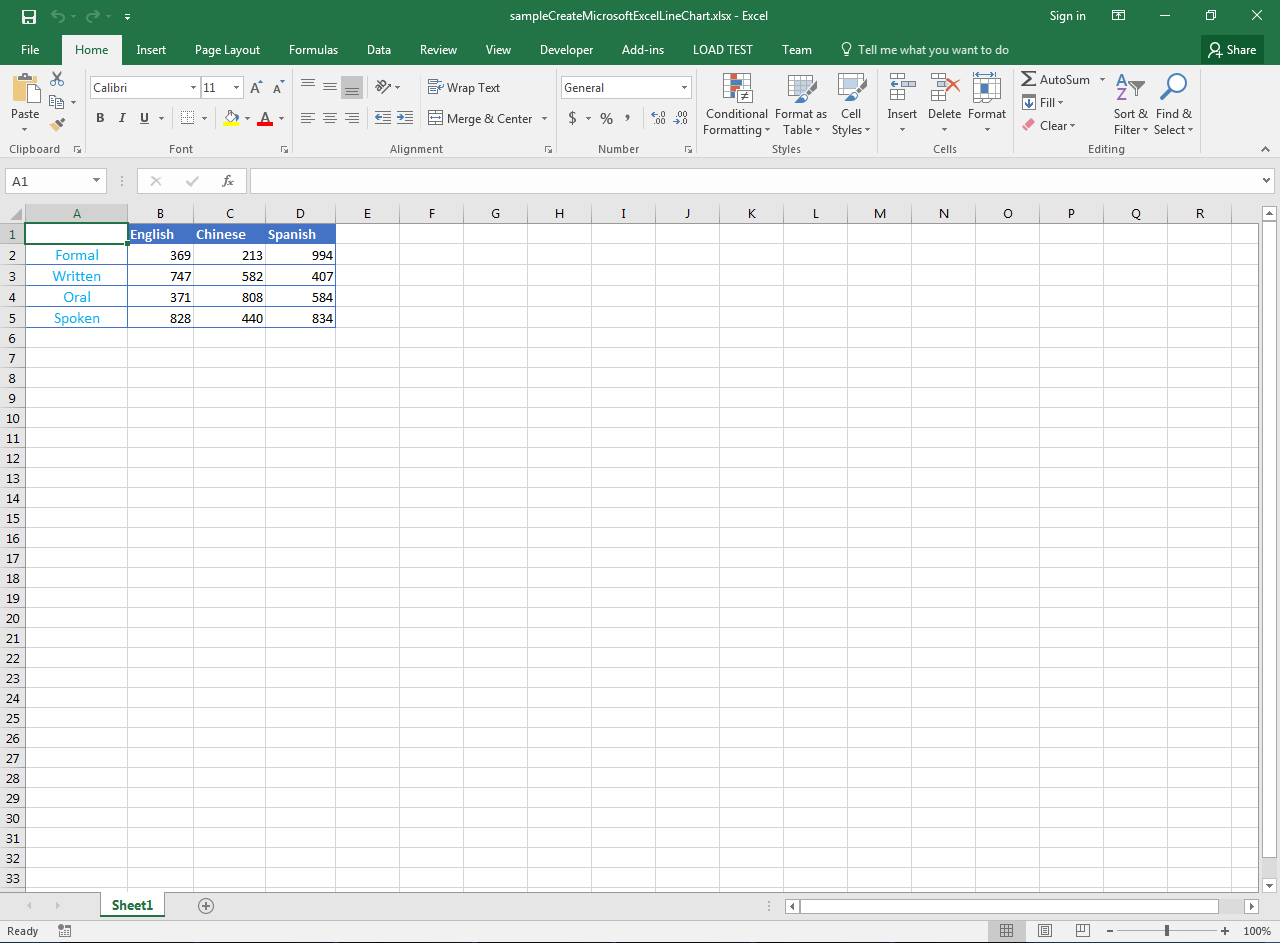
Sample Input Microsoft Excel Document
For demonstration, we will use the following sample input Microsoft Excel document that contains the chart data. Here, column A contains the category axis data and other columns B, C and D contain chart series data.
Sample Code
The following sample code creates Microsoft Excel Line Chart by performing these steps.
- Load sample input Microsoft Excel document containing the chart data.
- Create Line chart with specified dimensions.
- Apply the two color gradient on the chart area.
- Set the chart title and format it.
- Add three vertical series, set their names and line weights.
- Format various chart items e.g. plot area, value axis, category axis, major tick marks etc.
- Save the workbook in XLSX format. You can also save it in other formats e.g. XLS, XLSB, XLSM etc.
This file contains bidirectional Unicode text that may be interpreted or compiled differently than what appears below. To review, open the file in an editor that reveals hidden Unicode characters.
Learn more about bidirectional Unicode characters
| // Directory path of input and output files. | |
| String dirPath = "D:/Download/"; | |
| // Load source Excel file containing the chart data. | |
| Workbook wb = new Workbook(dirPath + "sampleCreateMicrosoftExcelLineChart.xlsx"); | |
| // Access first worksheet. | |
| Worksheet ws = wb.getWorksheets().get(0); | |
| // Specify dimensions of the chart. | |
| int upperLeftRow = 7; | |
| int upperLeftColumn = 4; | |
| int lowerRightRow = 24; | |
| int lowerRightColumn = 13; | |
| // Create Line chart with specified dimensions. | |
| int idx = ws.getCharts().add(ChartType.LINE, upperLeftRow, upperLeftColumn, lowerRightRow, lowerRightColumn); | |
| // Access the Line chart. | |
| Chart ch = ws.getCharts().get(idx); | |
| // Get the white and greenish color. | |
| Color clr1 = Color.fromArgb(255, 255, 255); | |
| Color clr2 = Color.fromArgb(226, 240, 217); | |
| // Apply two color gradient on the chart area. | |
| ch.getChartArea().getArea().getFillFormat().setTwoColorGradient(clr1, clr2, GradientStyleType.FROM_CENTER, 1); | |
| // Set the chart title, make it non-bold and set its font size. | |
| ch.getTitle().setText("Classification of Languages"); | |
| ch.getTitle().getFont().setBold(false); | |
| ch.getTitle().getFont().setSize(15); | |
| // Add three vertical series in chart covering the range B2:D5. | |
| ch.getNSeries().add("B2:D5", true); | |
| // Set the category data covering the range A2:A5. | |
| ch.getNSeries().setCategoryData("A2:A5"); | |
| // Set the names of the chart series taken from cells. | |
| ch.getNSeries().get(0).setName("=B1"); | |
| ch.getNSeries().get(1).setName("=C1"); | |
| ch.getNSeries().get(2).setName("=D1"); | |
| // Set the line weight of the chart series. | |
| ch.getNSeries().get(0).getBorder().setWeight(WeightType.MEDIUM_LINE); | |
| ch.getNSeries().get(1).getBorder().setWeight(WeightType.MEDIUM_LINE); | |
| ch.getNSeries().get(2).getBorder().setWeight(WeightType.MEDIUM_LINE); | |
| // Set plot area formatting as none and hide its border. | |
| ch.getPlotArea().getArea().getFillFormat().setFillType(FillType.NONE); | |
| ch.getPlotArea().getBorder().setVisible(false); | |
| // Set value axis major tick mark as none and hide axis line. | |
| // Also set the color of value axis major grid lines. | |
| ch.getValueAxis().setMajorTickMark(TickMarkType.NONE); | |
| ch.getValueAxis().getAxisLine().setVisible(false); | |
| ch.getValueAxis().getMajorGridLines().setColor(Color.fromArgb(217, 217, 217)); | |
| // Set category axis major tick mark as none. | |
| // Also set the color of category axis major grid lines. | |
| ch.getCategoryAxis().setMajorTickMark(TickMarkType.NONE); | |
| ch.getCategoryAxis().getAxisLine().setColor(Color.fromArgb(217, 217, 217)); | |
| // Save the output Excel file in XLSX format. | |
| wb.save(dirPath + "outputCreateMicrosoftExcelLineChart.xlsx", SaveFormat.XLSX); |
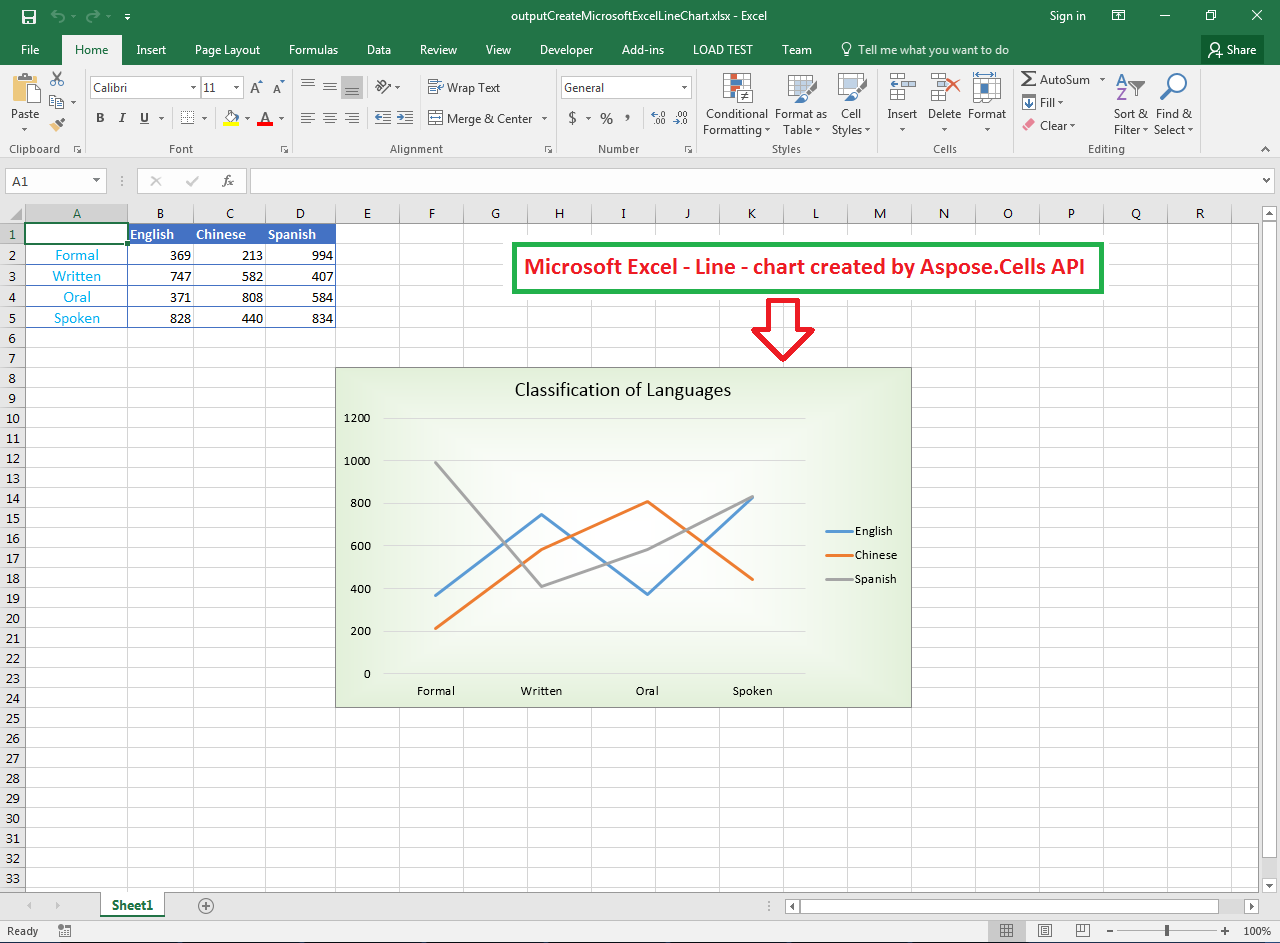
Output Microsoft Excel Line Chart by Aspose.Cells
The following snapshot shows the Output Microsoft Excel Line Chart generated by Aspose.Cells with the code given above. Similarly, you can create all sorts of Line charts with Aspose.Cells API easily.